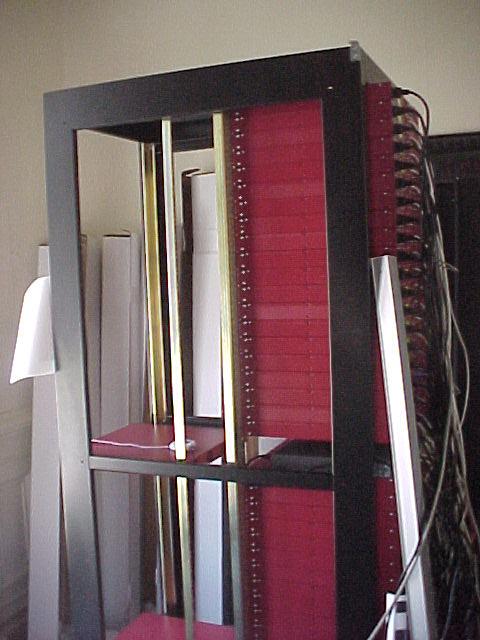
This is the first rack of the PetaBox. One full rack contains 80 nodes, which comes to just 96TB. There will eventually be ten racks shipped to Amsterdam.
|

As you can see, the back side of this rack is not yet filled.
|

A close-up of the top few nodes of the rack.
|
| | | | |

A close-up of node ia21140. The LCD display is spiffy. The numbers along the top are the disk temperatures and the CPU temperature, in degrees Celsius. The dot on the CPU temperature blinks on and off to show that the system is "healthy".
|

A close-up of node ia21143. The temperature for /dev/hdd is '??', showing that there are I/O errors in /var/log/messages for this drive. This is more of a gee-whiz feature than anything else, since the cluster's health is monitored via Nagios.
|

This is the 'homeserver' node. It has a more powerful CPU and more memory, and provides some special services for the cluster, such as CVS, NFS, and Nagios. It also stores the installation images so that new machines can be installed via network to homeserver.
|
| | | | |

This is the ethernet switch for this side of the rack.
|

These are the USB storage devices we use as "boot proms" for the redbox nodes. They store 256MB each, and are bootable, so that they can be used as "rescue floppies", or to install the OS on new "blank" redbox nodes. They boot to a doctored-up FeatherLinux installation. Only about 80MB are currently being used.
|

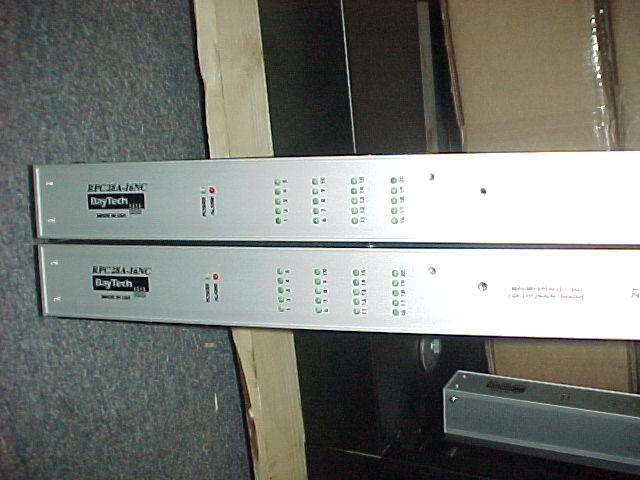
This is a view of one of the power bars used by the PetaBox. It can be used via serial or ethernet link to monitor the power consumption of each plug, and told to turn on/off power on each plug. This is handy if you want to cycle power on a specific node from your desk, as opposed to running down the aisle and pushing a power switch. It also powers up a rack sequentially on initial power-on, so that not all the nodes are turned on at exactly the same time.
|
| | | | |

This is a view of the same power bar from the other end. The little rectangular boxes are LCD's that show the current status of each plug (power on/off).
|